For iPhone & iPad
Turn spreadsheets into beautiful maps.
Create clean, publication-ready choropleth maps in seconds. Import a CSV, ask AI for data, then export crisp SVG, PDF, or PNG.
No design tools. No GIS software. No tracking.
Create clean, publication-ready choropleth maps in seconds. Import a CSV, ask AI for data, then export crisp SVG, PDF, or PNG.
No design tools. No GIS software. No tracking.
Bring your data any way you like, style it beautifully, and export it wherever you need it.
Import a CSV from your device or load one straight from a URL. Columns are auto-detected and matched to the right regions.
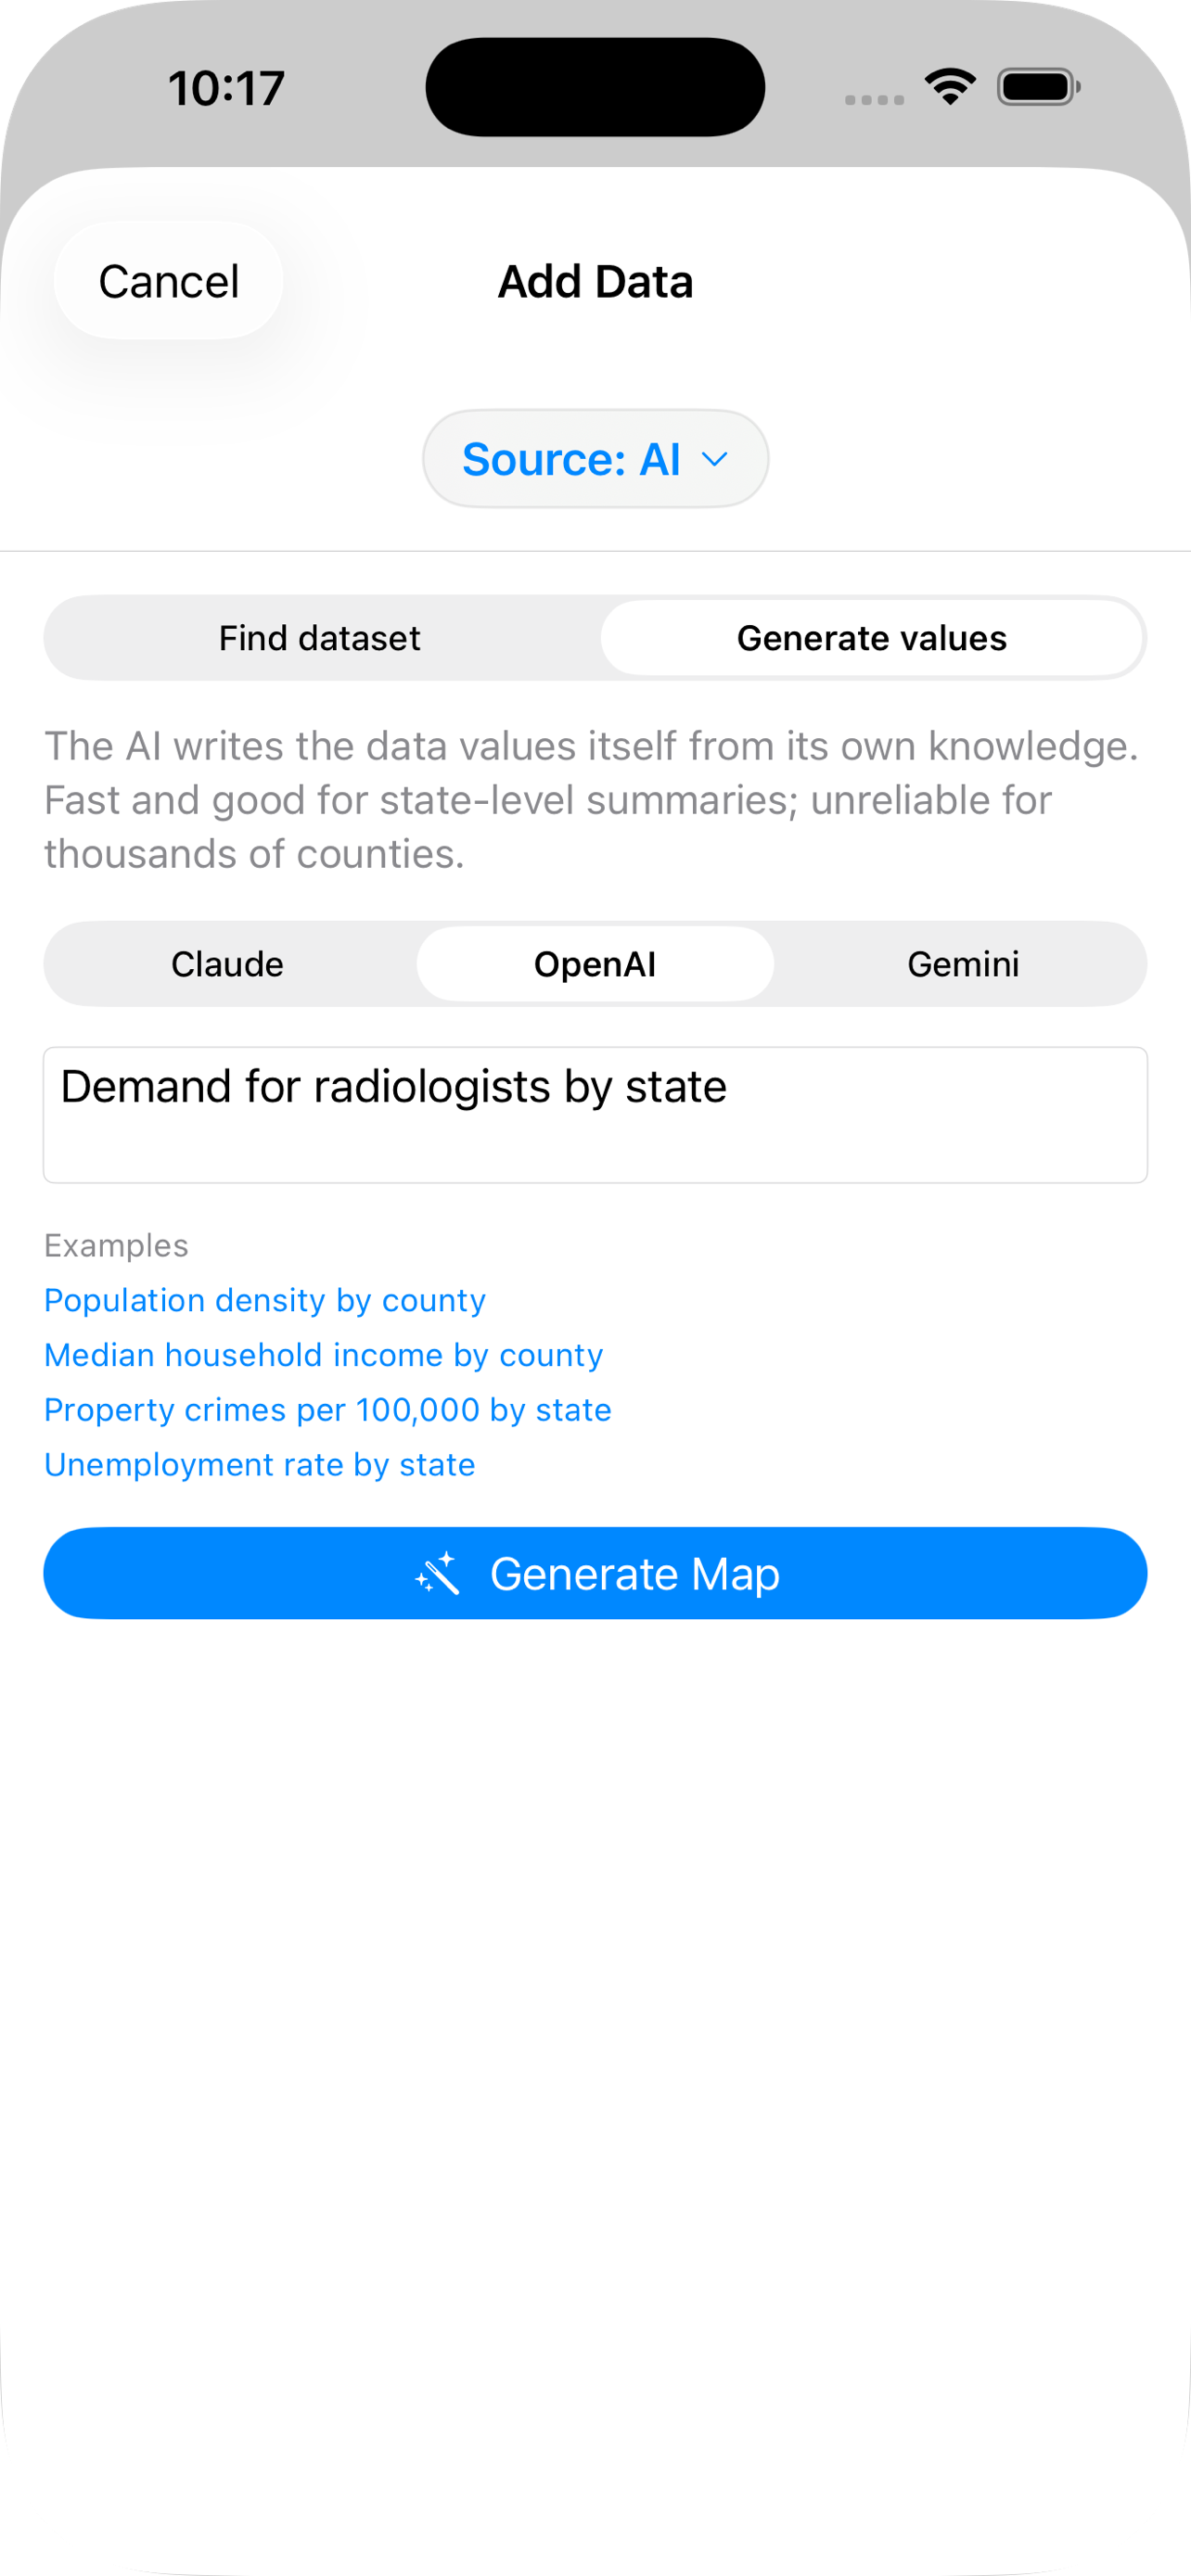
Describe what you want to map and let Anthropic, OpenAI, or Gemini fill in the values automatically — no spreadsheet required.
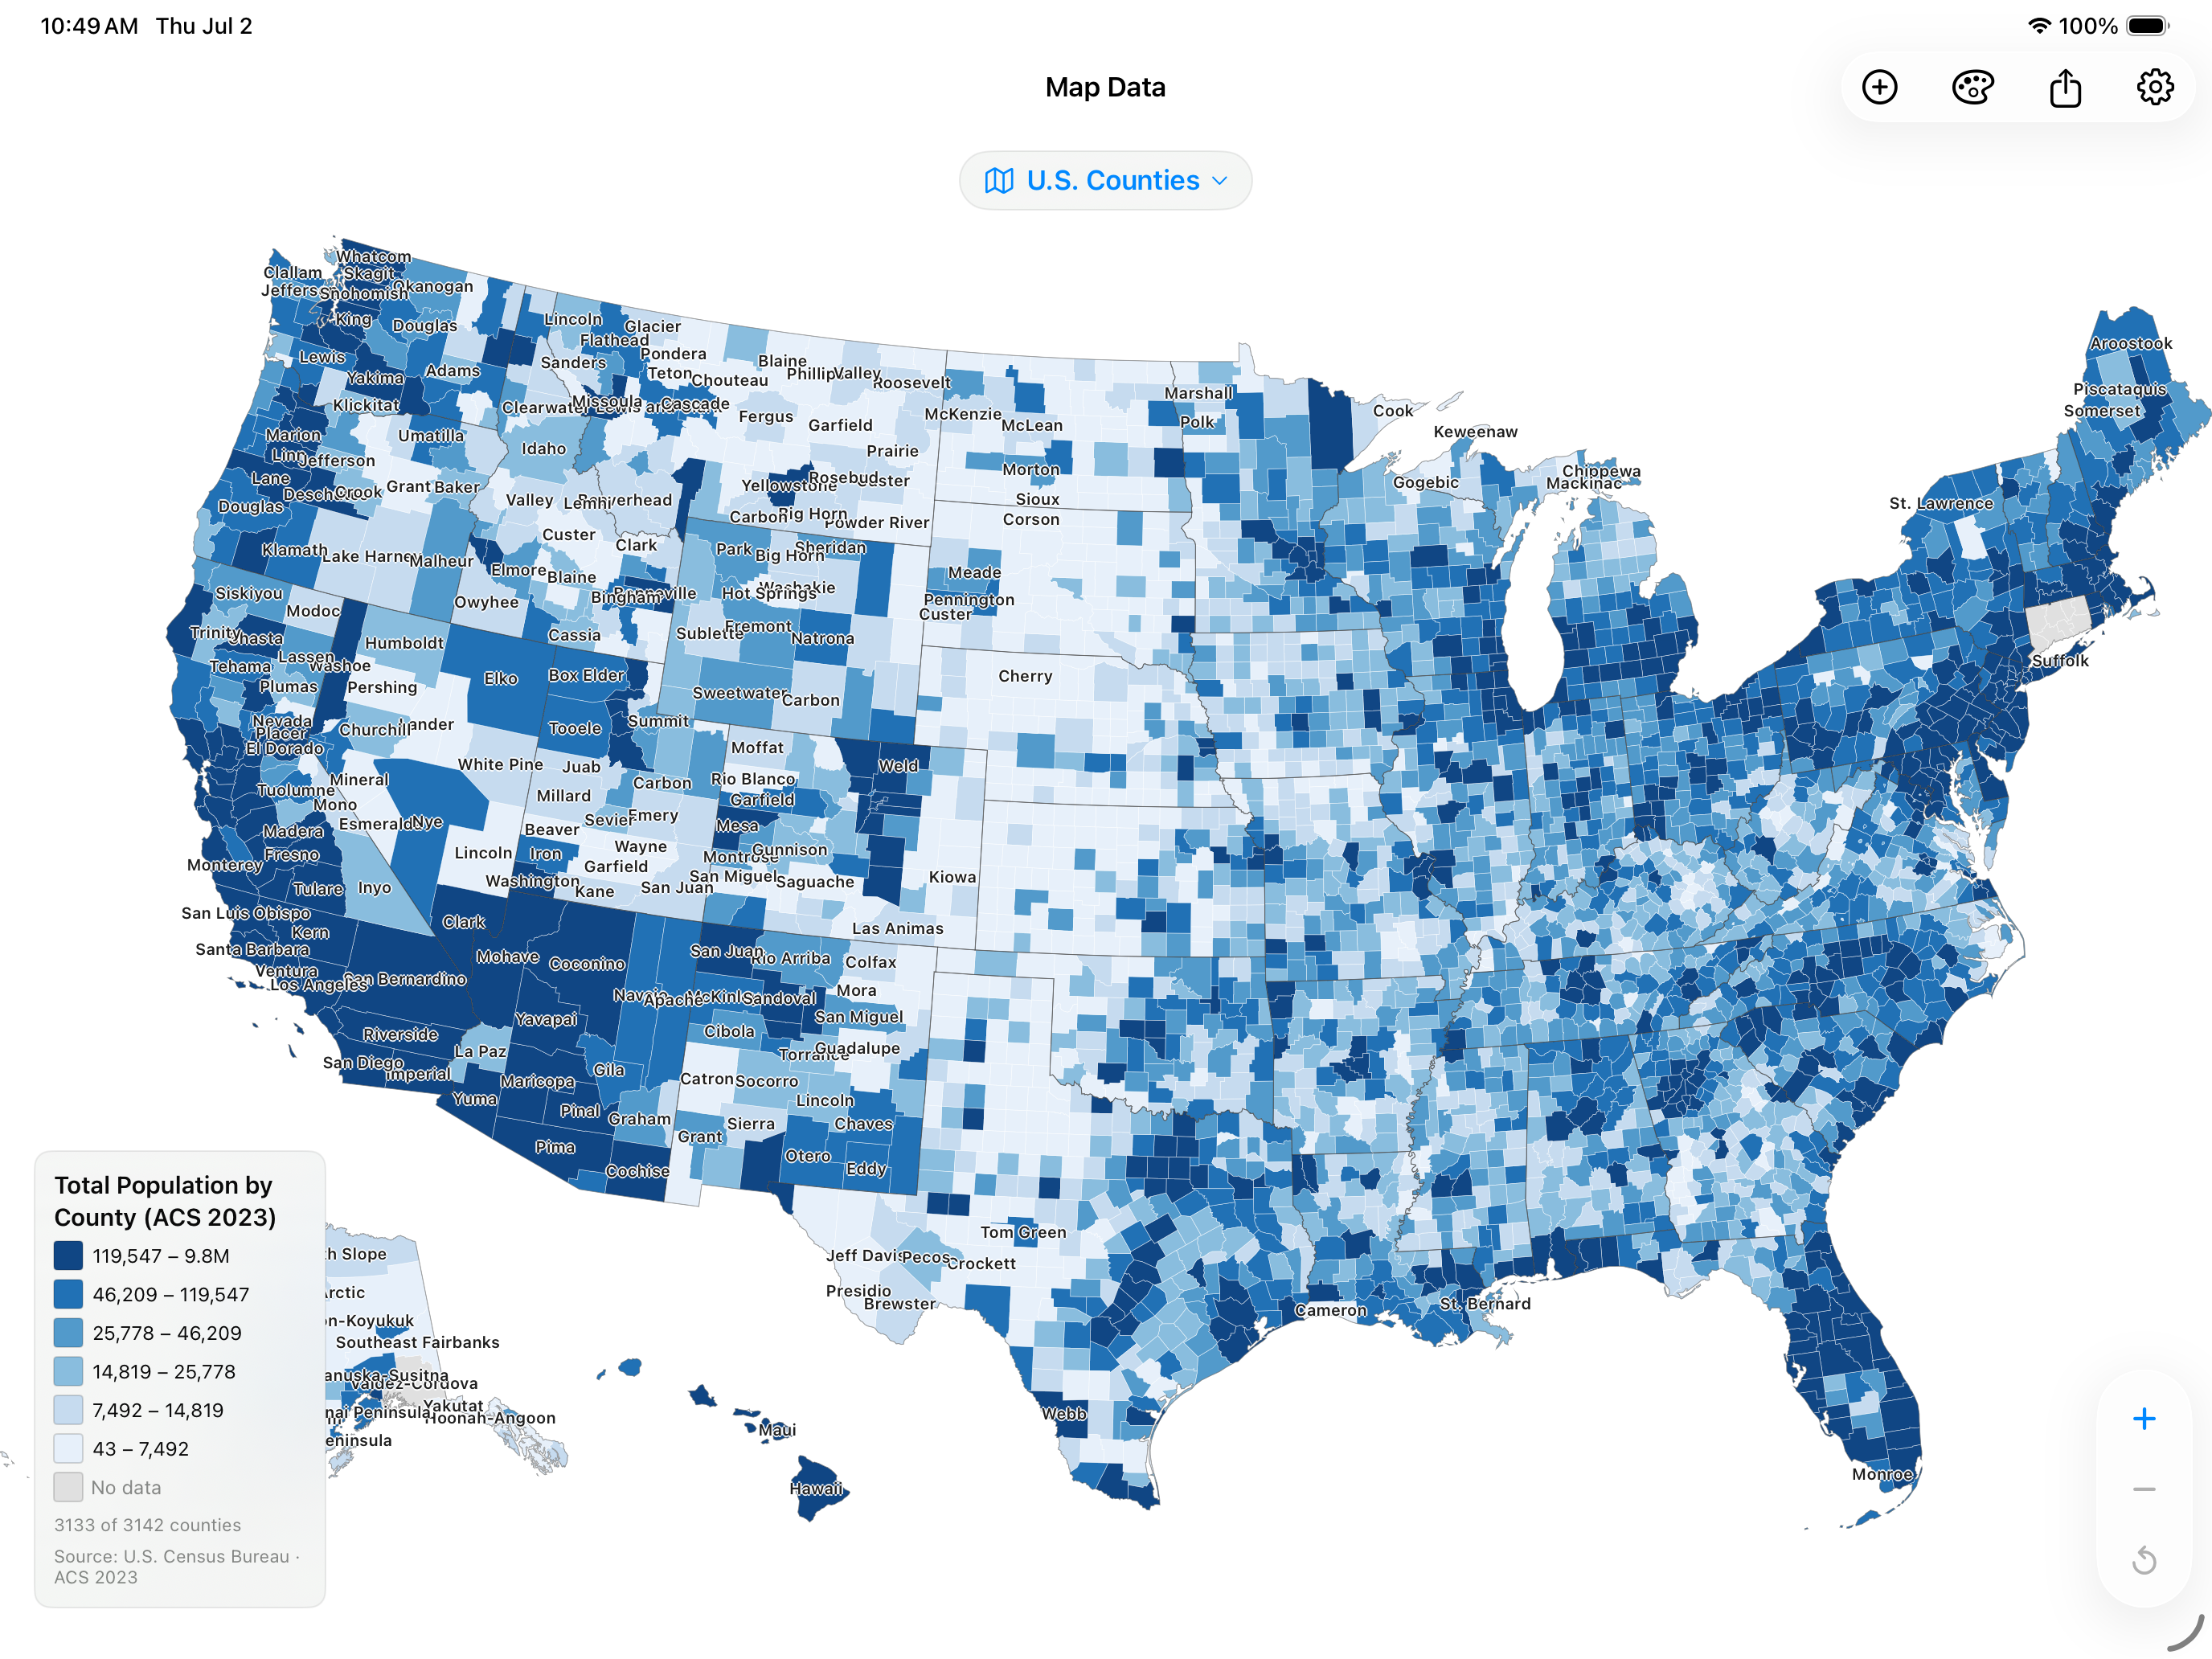
All 50 states plus D.C. and every one of the 3,142 counties, drawn with a proper Albers USA projection and Alaska & Hawaii insets.
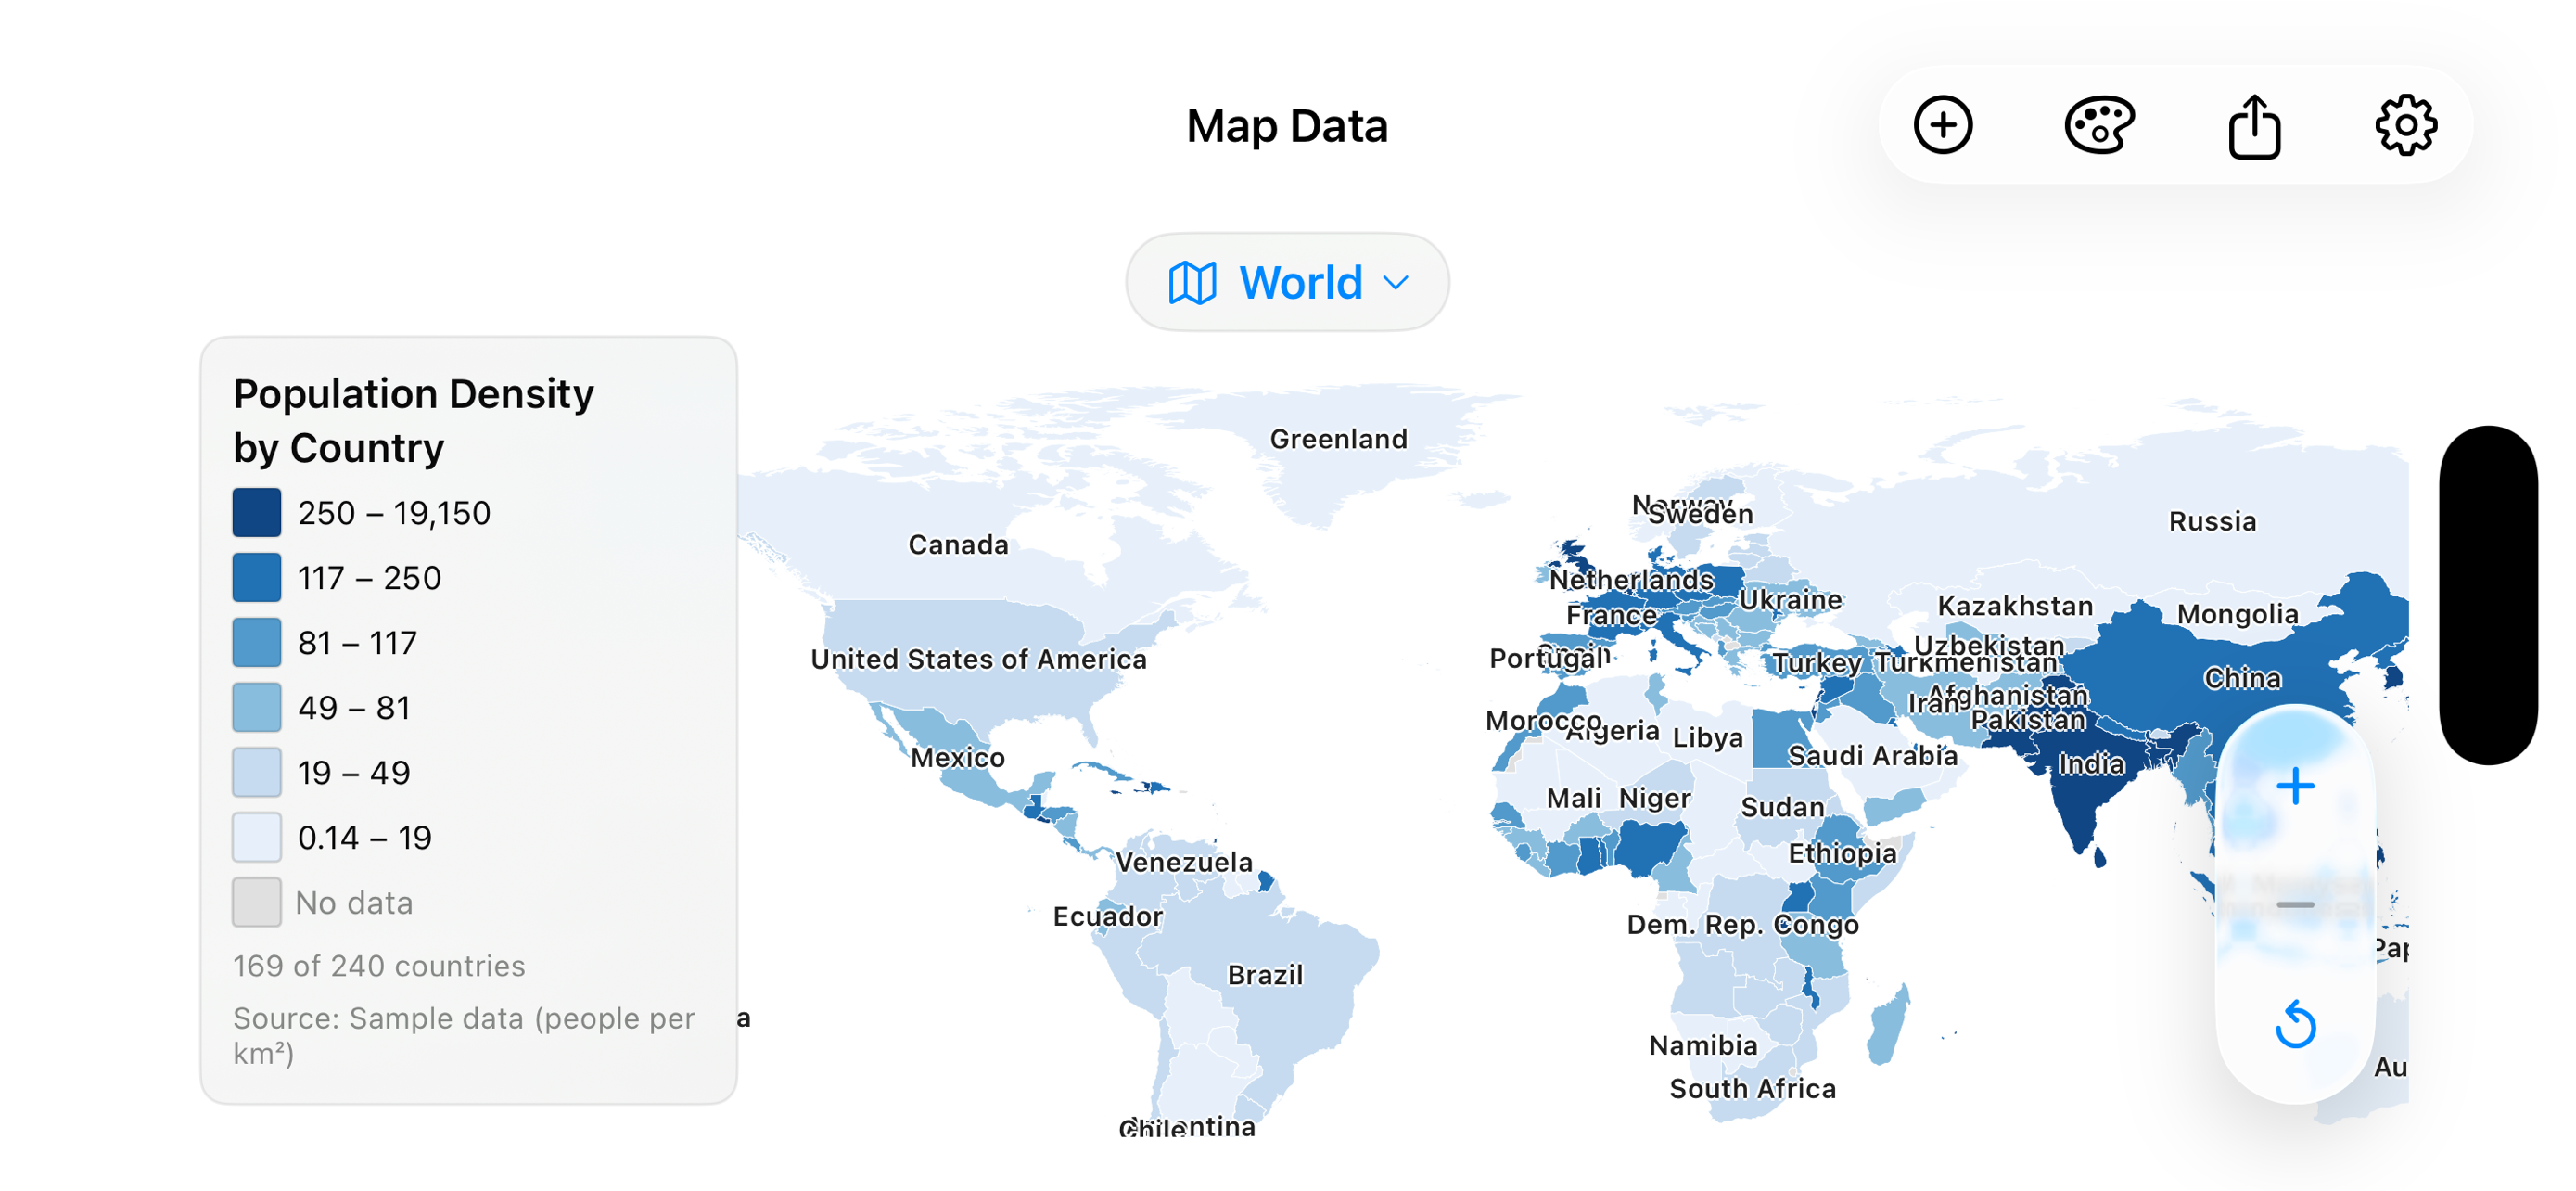
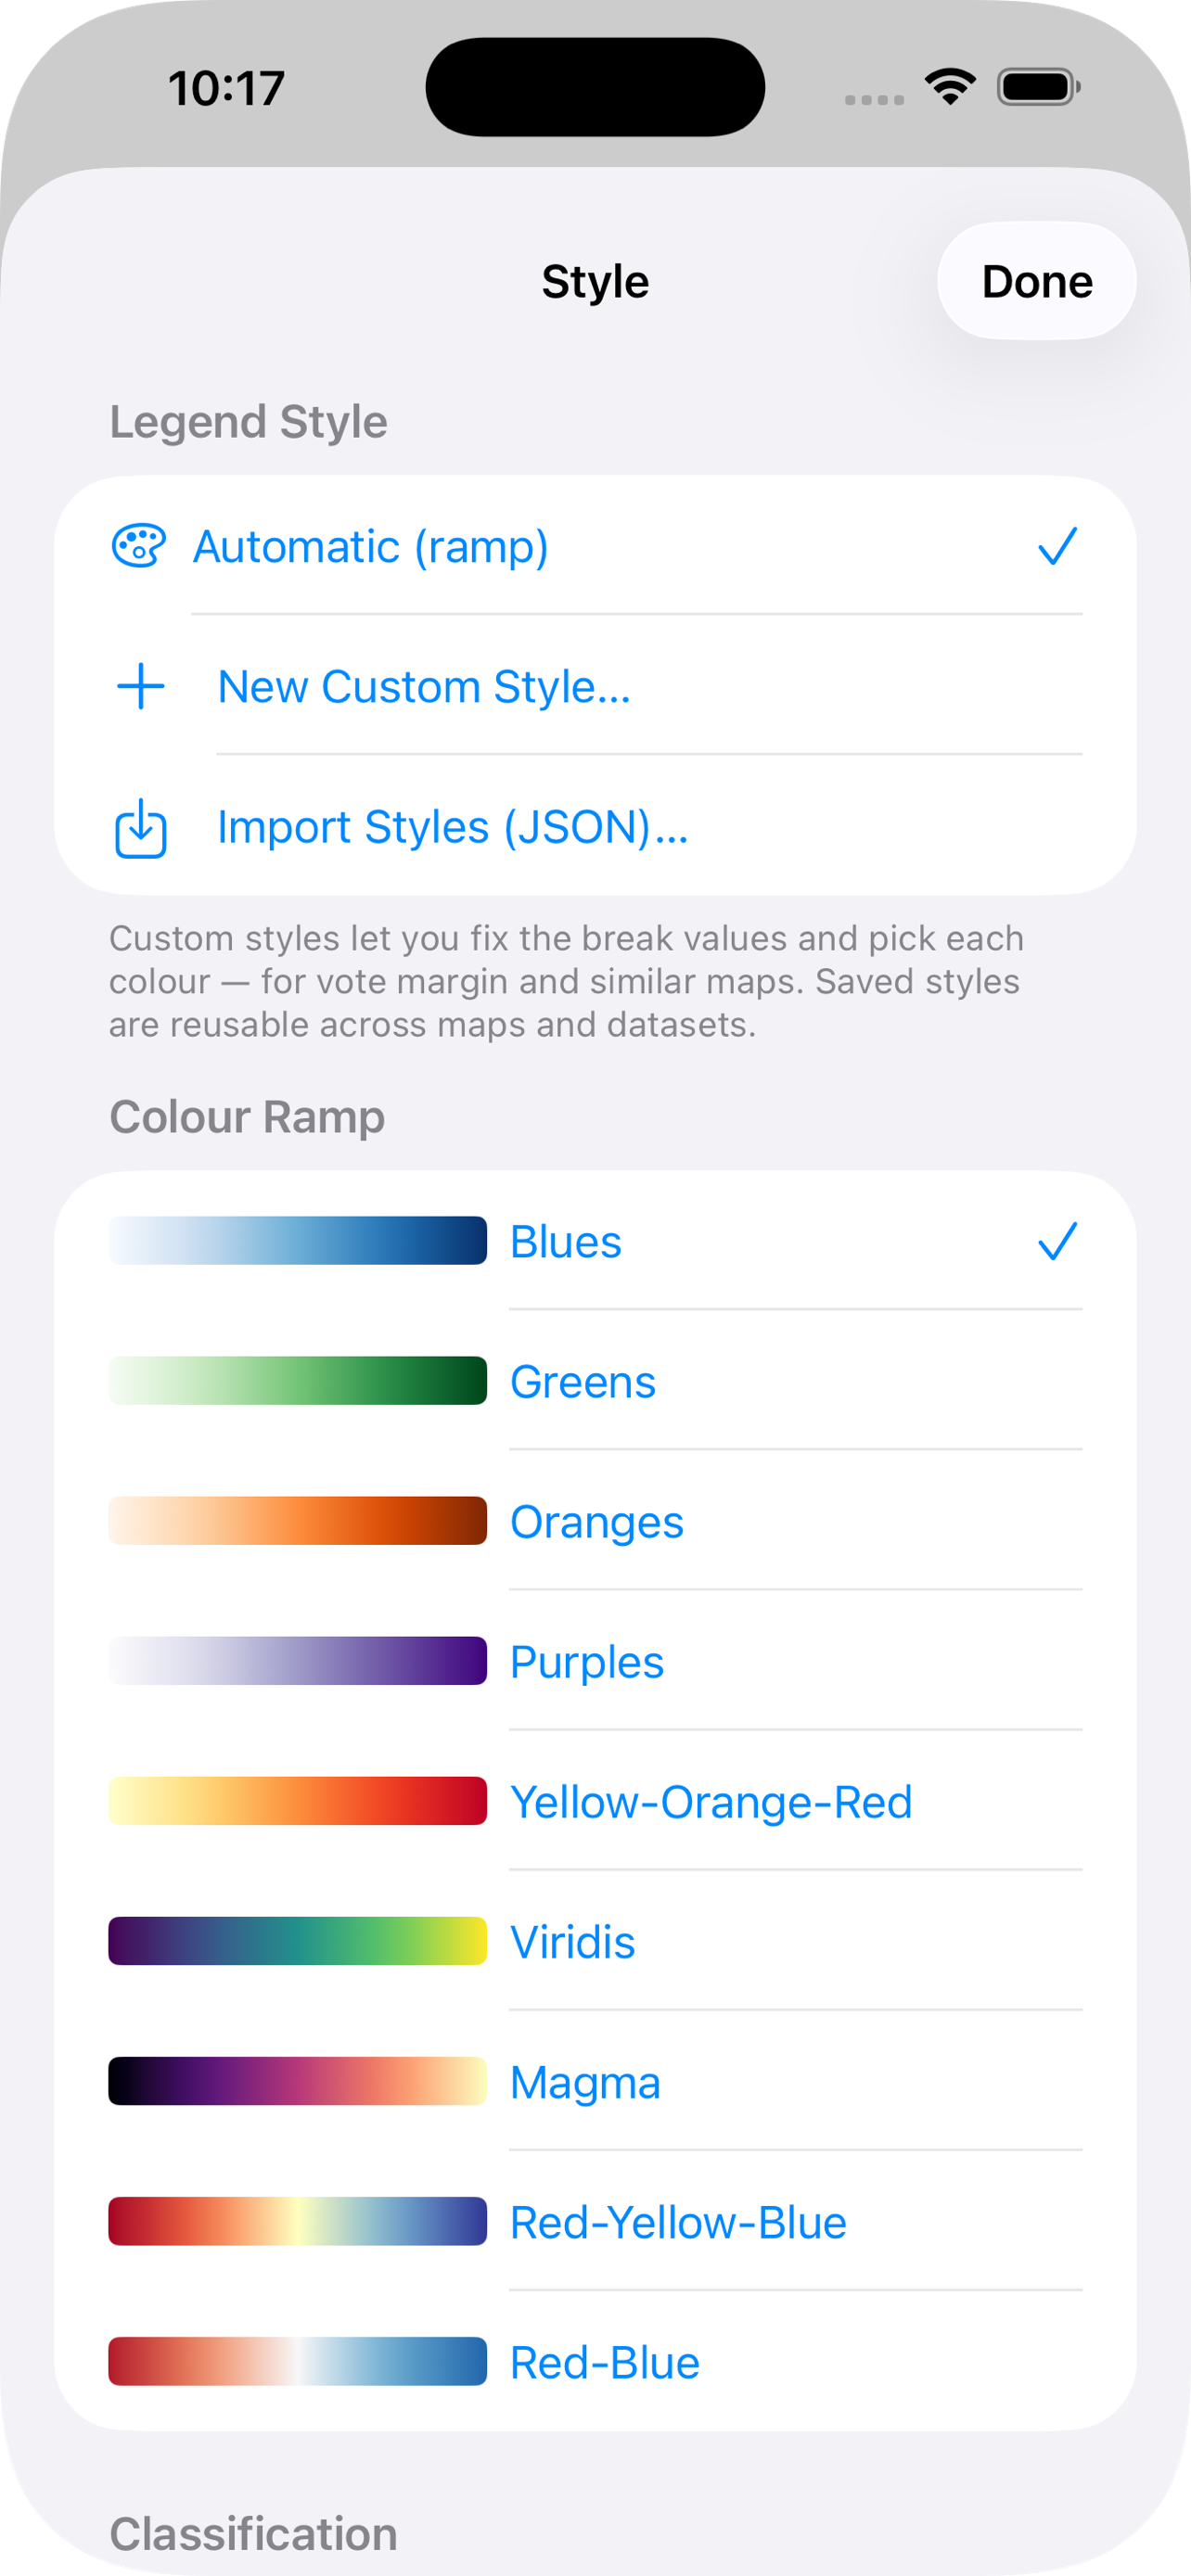
Multiple color palettes with quantile, equal-interval, or continuous scales — and clear, automatic legends every time.
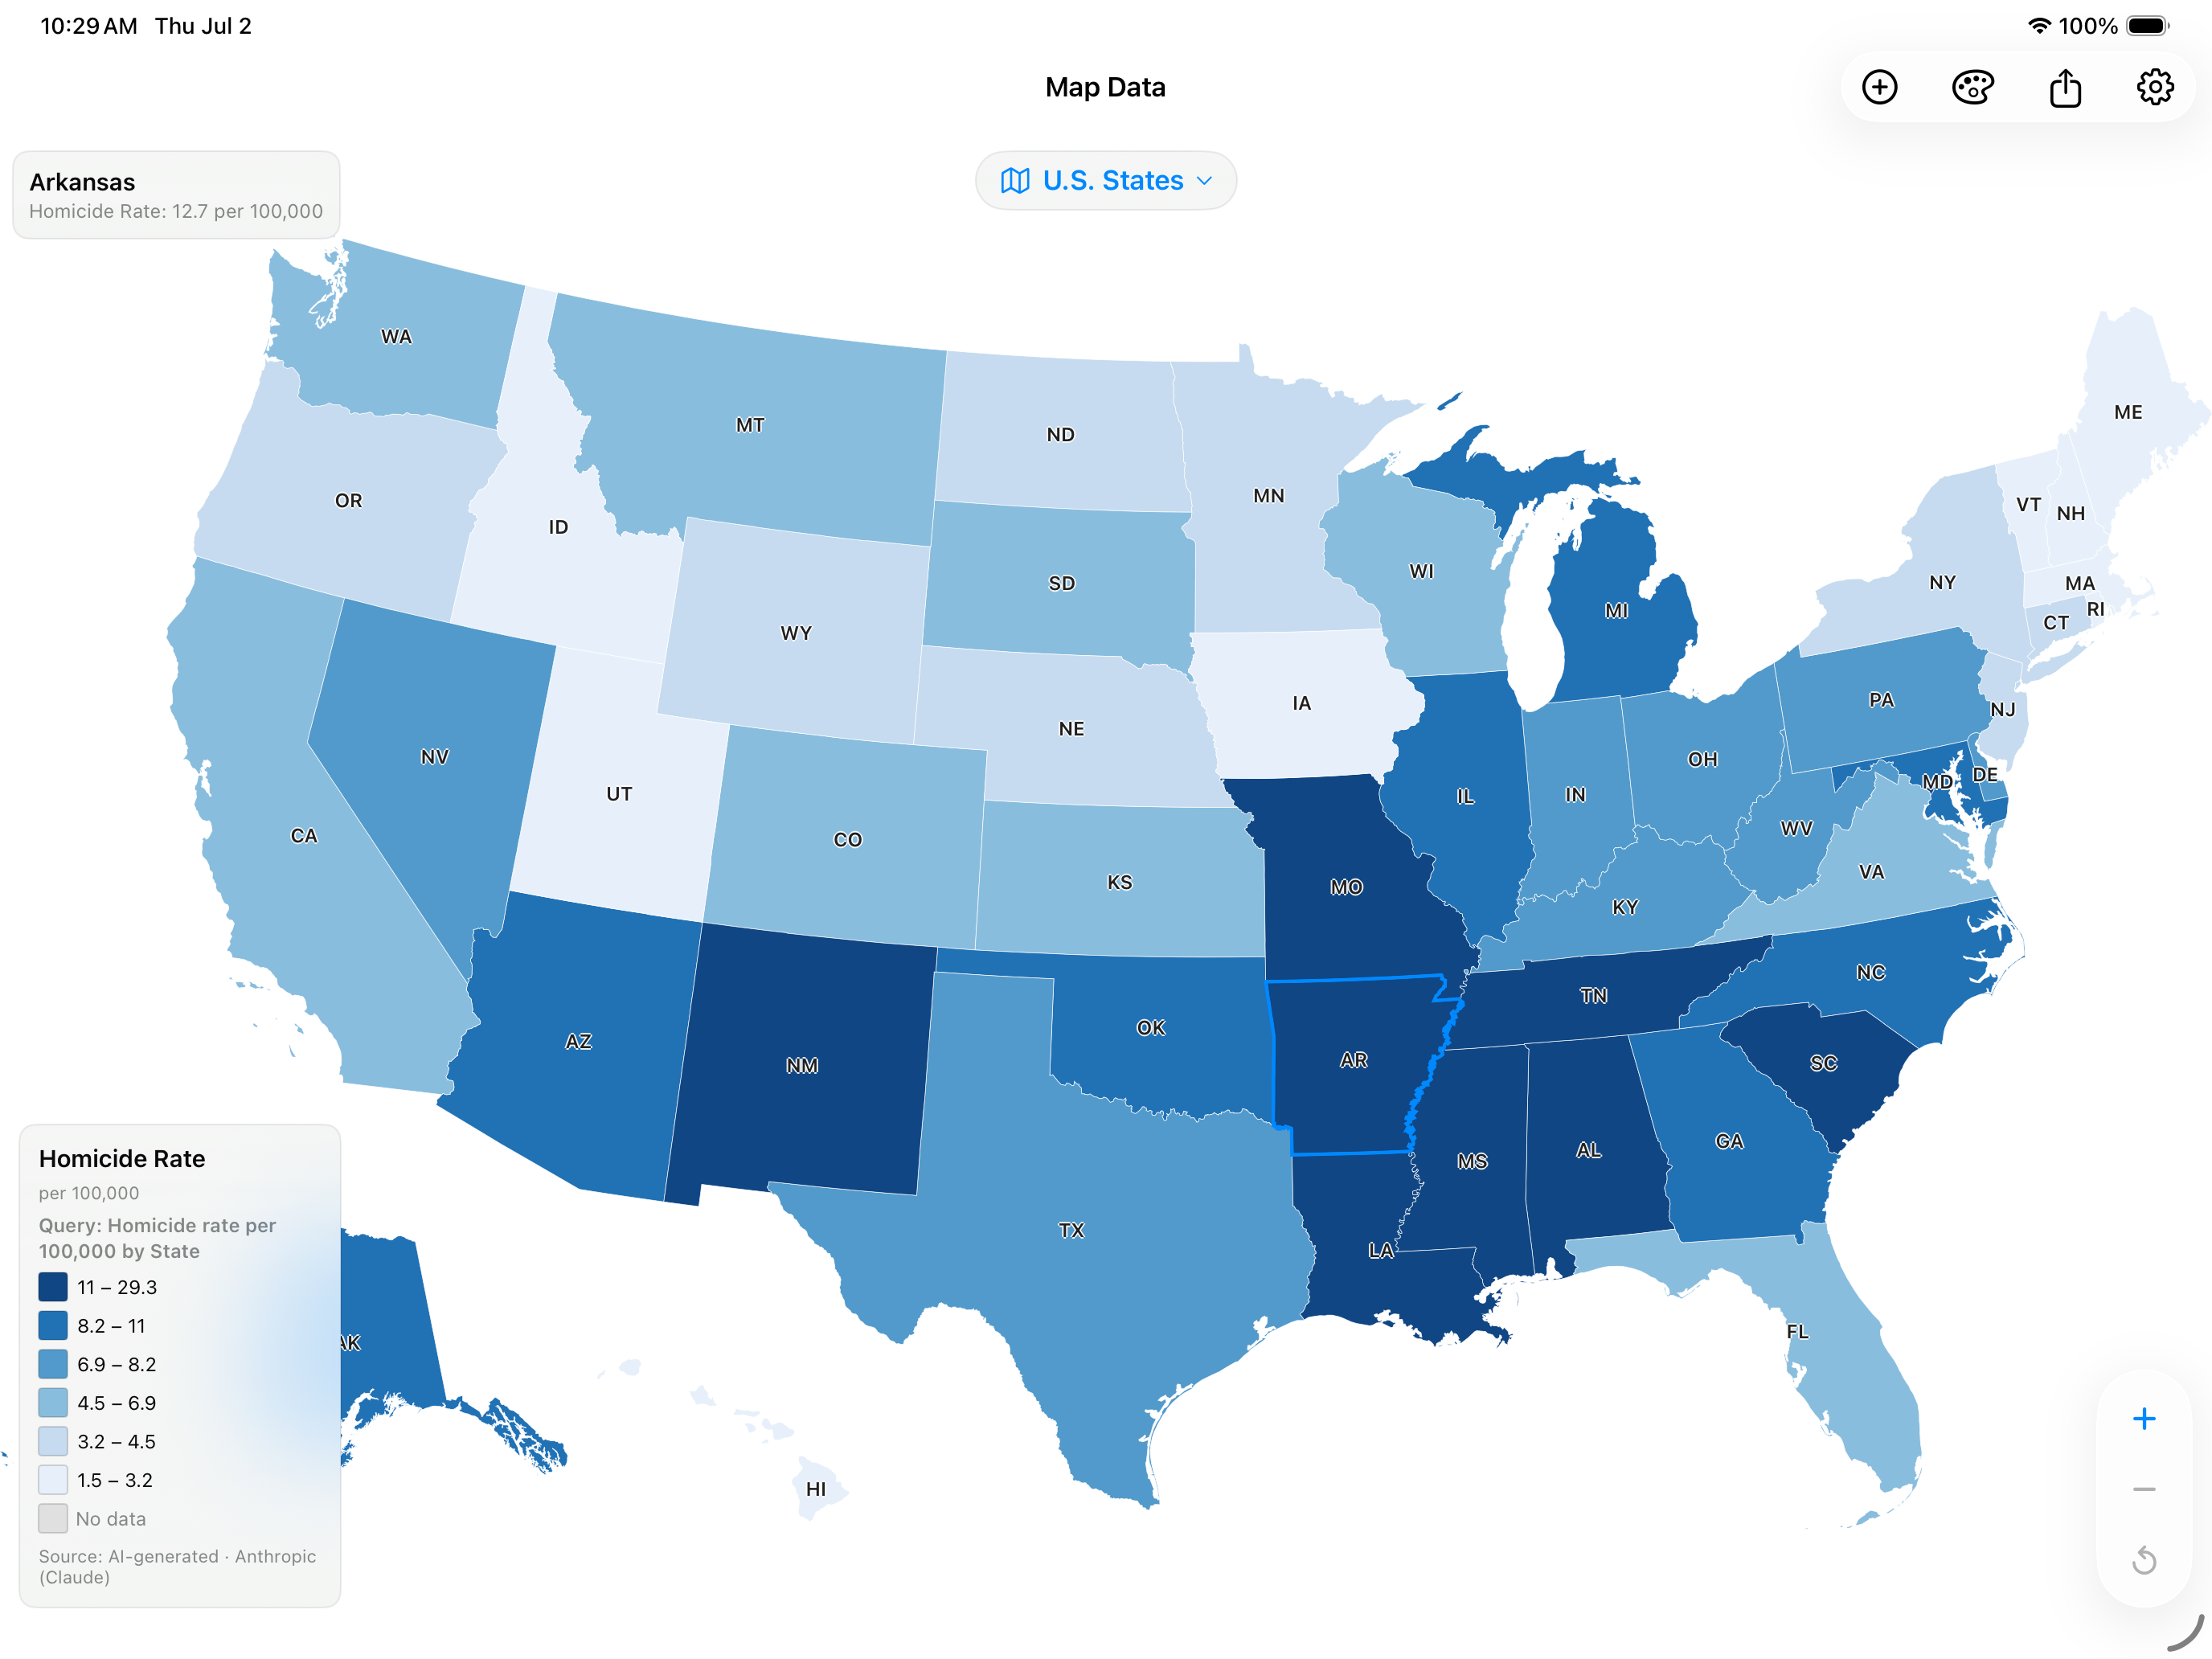
Pinch to zoom and pan smoothly across the map, and tap any region to reveal its exact value.
Save your map as scalable SVG, print-ready PDF, shareable PNG, or export the joined data itself back out as CSV.
Native SwiftUI, fast off-thread geometry, and maps that look great on every screen.
Map all 3,142 U.S. counties at once. Map Data stitches and projects the geometry off the main thread, so panning and zooming stay smooth even at full county resolution.
Switch between color ramps and binning methods — quantile, equal-interval, or continuous — and get a readable legend automatically. Every map looks intentional.
One tap to the format that fits your workflow — slides, documents, print, or further analysis.
Crisp, infinitely scalable vector graphics.
Print-ready pages for reports and documents.
High-resolution images for slides and sharing.
Export the joined data itself for reuse.
Map Data is a native app for iPhone and iPad. Perfect for journalists, researchers, students, and analysts who need to see their data on a map.
Download on the App Store